|
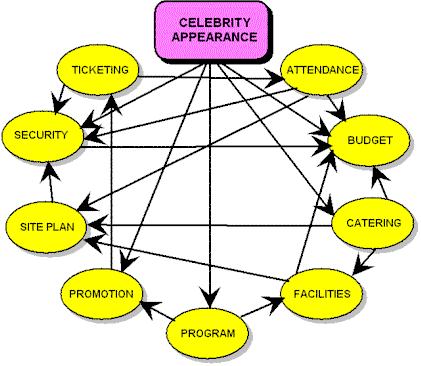
Influence Diagram 31 December 2004 This is a graphical evaluation tool similar to mind mapping that illustrates the effects and scope of interactions any one element or change will have on other event elements, plans, and associated risks. Sometimes referred to as a Relations Diagram, this tool may also be used to help identify the factors in a situation that are driving many of the other symptoms or factors. The arrows start at the influencing factor and end at the factor being influenced. The factors with the most outgoing arrows will be root causes or drivers.
see also Risk / Opportunity Analysis |
|